Swing Failure Pattern Chart
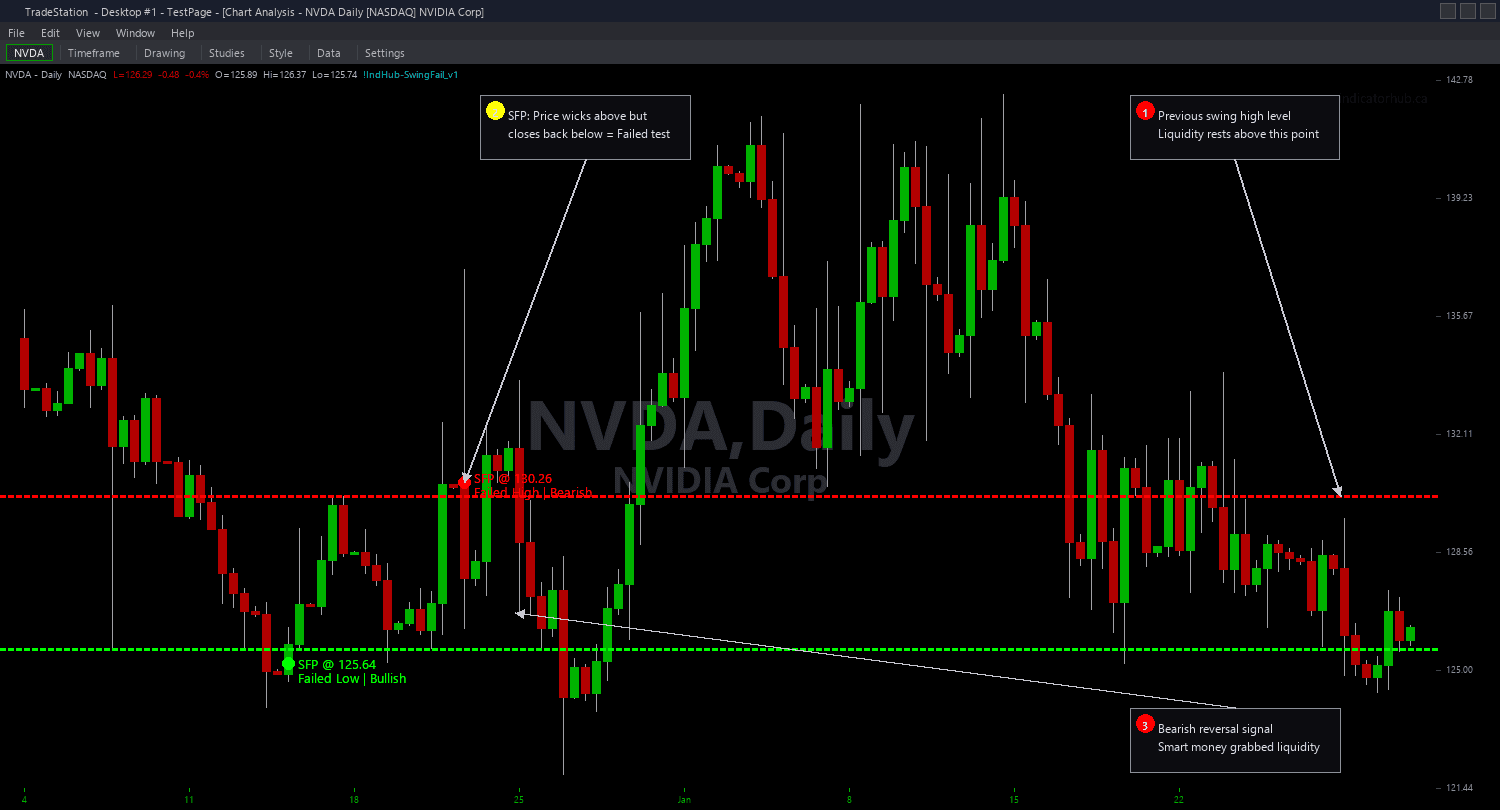
Swing Failure Pattern Chart identifies bars that wick beyond established swing levels but fail to close beyond them, drawing clear visual annotations: a horizontal line at the tested swing level and a marker at the wick extreme. A bullish SFP occurs when the low wicks below a prior swing low but the close stays above it — institutions swept the sell stops and reversed. A bearish SFP occurs when the high wicks above a prior swing high but the close stays below it — institutions swept the buy stops and reversed.
- ●Green horizontal lines mark the tested swing low level in bullish SFPs, with a green marker at the wick extreme below — the distance between the line and the marker shows how deep the pierce was before rejection
- ●Red horizontal lines mark the tested swing high level in bearish SFPs, with a red marker at the wick extreme above — showing the depth of the failed breakout
- ●SwingStrength (default 5) controls how significant the swing highs and lows must be — higher values require more bars on each side of the pivot, finding only major swing levels
- ●MaxPatterns (default 10) limits the number of simultaneous SFP annotations to keep charts clean
- ●MaxAge (default 50 bars) controls how long SFP annotations persist on the chart before expiring
- ●MinRejectionRatio (default 0.5) requires the rejection wick to be at least 50% of the total bar range — this filters out weak failures where the bar barely closed inside the swing level
- ●MinPierceDepth (default 0.05) requires the wick to penetrate at least 0.05x ATR beyond the swing level — this ensures the sweep was meaningful and not just a tick beyond the level
- ●Plot1 outputs +1 on bullish SFP bars, -1 on bearish SFP bars, and 0 otherwise for subgraph reference
The best SFP setups have three characteristics: a well-established swing level (tested multiple times or formed with high SwingStrength), a deep pierce that clearly swept beyond the level (MinPierceDepth 0.1+), and a strong rejection back inside (MinRejectionRatio 0.6+). When all three align, you have a textbook liquidity sweep and reversal.
All detection uses completed bar data only. Non-repainting guaranteed.
30-Day Money-Back Guarantee
Try it risk-free. Not satisfied? Full refund, no questions asked.
Part of the Swing Failure Pattern Bundle
Get all 4 study types for $65 — save $30
Who This Is For
Swing Failure Pattern Chart is built for price action and SMC traders who identify liquidity sweeps at swing levels as high-probability reversal setups. If you manually watch for price to wick beyond swing highs and lows and close back inside, this indicator automates that detection with configurable quality filters.
Use it on intraday charts (1-minute to 15-minute) for day trading reversal entries. The default SwingStrength of 5 works well for 1-minute and 5-minute charts on liquid stocks and futures. For swing trading on hourly or daily charts, increase SwingStrength to 8-10 to focus on major swing levels that have real structural significance.
The indicator performs best on liquid markets where swing levels carry genuine stop-loss clusters: index futures (ES, NQ, YM), NASDAQ-100 stocks, S&P 500 components, and high-volume ETFs. Thin or illiquid markets may produce SFP patterns from random noise rather than institutional stop hunting.
When a bullish SFP fires, enter long with a stop below the wick extreme (the marker). When a bearish SFP fires, enter short with a stop above the wick extreme. The pierce depth shows you exactly where your stop should go — just beyond the wick extreme where institutions swept liquidity.
Combines well with Order Blocks and Fair Value Gaps. An SFP that occurs at an order block zone or inside a Fair Value Gap has multi-concept confluence — the strongest setup in SMC analysis.
See It in Action

Example chart showing Swing Failure Pattern Chart on a live trading session

Example chart showing Swing Failure Pattern Chart on a live trading session
Installation Guide
Step 1: Download the indicator file
After purchasing, you will receive a download link via email. Click the link and save the swing-failure-chart.eld file to your computer. Save it somewhere easy to find like your Desktop or Downloads folder.
Step 2: Open the Import Wizard
Open TradeStation. Click the File menu in the top-left corner, then select Import/Export EasyLanguage to launch the Import/Export Wizard.

Step 3: Select the import type
In the Import/Export Wizard, select "Import EasyLanguage file (ELD, ELS or ELA)" from the list. Click Next to continue.

Step 4: Browse for the file
Click the Browse button to open a file browser where you can locate your downloaded .ELD file.

Step 5: Select and open the file
Navigate to the folder where you saved the .ELD file. Select swing-failure-chart.eld and click Open. The file name shown may differ from the screenshot — look for your downloaded indicator file.

Step 6: Open the Studies menu
On your chart, click the Studies dropdown in the toolbar and select Add Study.

Step 7: Select the indicator
In the Add Studies dialog, make sure the Indicator tab is selected on the left side. Find "!IndHub-SwingFailure_Chart_v1" in the list, select it, and click OK to apply.

Step 8: Configure settings (optional)
Right-click anywhere on the chart, go to Studies > Edit Studies..., select the indicator, and click the Inputs tab. Key inputs: SwingStrength (default 5, pivot sensitivity), MaxPatterns (default 10), MaxAge (default 50, annotation expiration), MinRejectionRatio (default 0.5, wick must be this fraction of bar range), MinPierceDepth (default 0.05, wick must penetrate this multiple of ATR beyond the swing level), ShowBullish/ShowBearish (toggle sides), BullColor/BearColor (annotation colors).
Common Issues
I see very few SFP signals on my chart. Is the indicator working?
Swing Failure Patterns are relatively rare by nature — they require price to reach a swing level, wick beyond it, and close back inside, all on a single bar. The dual quality filters (MinRejectionRatio and MinPierceDepth) further reduce signals to only high-quality failures. Try reducing SwingStrength to detect more swing levels, lowering MinRejectionRatio to 0.3, or lowering MinPierceDepth to 0.02 to see more signals. On higher timeframes, SFPs are less frequent but more significant.
The indicator detects an SFP but the swing level seems too close to current price. Is this valid?
The validity depends on the SwingStrength setting. Low SwingStrength values (2-3) identify minor swings that may be noise. Increase SwingStrength to 7+ to ensure the swing levels are structurally significant. Additionally, check that the swing level has some distance from current price before the SFP bar — patterns where the swing is only 1-2 bars old are less meaningful than those testing a level established 10+ bars ago.
What is the difference between Rejection Ratio and Pierce Depth?
Rejection Ratio measures the quality of the failure candle itself — what percentage of the bar's total range is the rejecting wick versus the body. A ratio of 0.7 means the wick accounts for 70% of the bar, indicating a powerful rejection. Pierce Depth measures how far the wick extended beyond the swing level relative to ATR — a depth of 0.15 means the wick penetrated 0.15x ATR beyond the level before rejecting. Together, they quantify both the aggressiveness of the sweep and the strength of the reversal.
Can I use this on daily or weekly charts for swing trading?
Yes. Increase SwingStrength to 10-15 for daily charts and 15-20 for weekly charts to find only the most significant swing levels. SFPs on higher timeframes are rarer but carry much more weight — a daily SFP at a major swing high can signal a multi-day reversal. You may want to lower MinPierceDepth on daily charts since ATR is larger and even small penetrations in points represent meaningful sweeps.
For additional help, contact support.