
Market Structure ShowMe
Market Structure ShowMe marks the exact bars where market structure breaks occur, using a four-color system that instantly distinguishes MSS reversals from BOS continuations and bullish from bearish direction. This is the most information-dense visual layer for structural analysis.
- ●Bright green dots ABOVE the bar mark MSS bullish reversals (+2) — the most significant bullish signal, indicating a trend change from bear to bull
- ●Light green dots ABOVE the bar mark BOS bullish continuations (+1) — uptrend confirmed, structure extending higher
- ●Light red dots BELOW the bar mark BOS bearish continuations (-1) — downtrend confirmed, structure extending lower
- ●Bright red dots BELOW the bar mark MSS bearish reversals (-2) — the most significant bearish signal, indicating a trend change from bull to bear
- ●The four-color system creates an instant visual hierarchy: bright colors demand attention (MSS reversal = trade decision), light colors are informational (BOS continuation = trend confirmation)
- ●DotOffset (default 0.3 ATR) positions markers clear of price bars for readability
- ●Optional text labels show the signal type (MSS/BOS) and the broken price level
- ●AlertOnMSS and AlertOnBOS inputs let you configure separate audio alerts for reversals versus continuations
The ShowMe gives you the clearest possible picture of when and where structural breaks occurred throughout a trading session. At a glance, you can see the narrative: a bright red dot starts a bearish trend, light red dots confirm it, then a bright green dot signals the reversal — the complete structure story told through four colors.
All signals are guaranteed non-repainting. Once a dot plots on a completed bar, it will never disappear.
30-Day Money-Back Guarantee
Try it risk-free. Not satisfied? Full refund, no questions asked.
Part of the Market Structure Bundle
Get all 4 study types for $65 — save $30
Who This Is For
Market Structure ShowMe is designed for traders who want the most direct, visual representation of structural break events on their charts. The four-color system tells you not just when breaks happen but what type they are, enabling faster decision-making.
Layer this study on top of the Market Structure chart indicator. The chart indicator draws lines at break levels for reference. The ShowMe marks the exact break bars with colored dots and optional labels. Together they give you both the level information and the timing information.
Use it on 5-minute to 15-minute charts for day trading. Watch for bright green dots (MSS bull) as reversal entry signals and light green dots (BOS bull) as trend continuation confirmations. When bright red dots appear, the trend has reversed — adjust your bias accordingly.
For a streamlined chart, disable ShowBOS in the ShowMe settings to show only MSS reversal dots. This gives you the cleanest possible view focused on trend change events only. Works on any liquid market with clear trending structure.
See It in Action
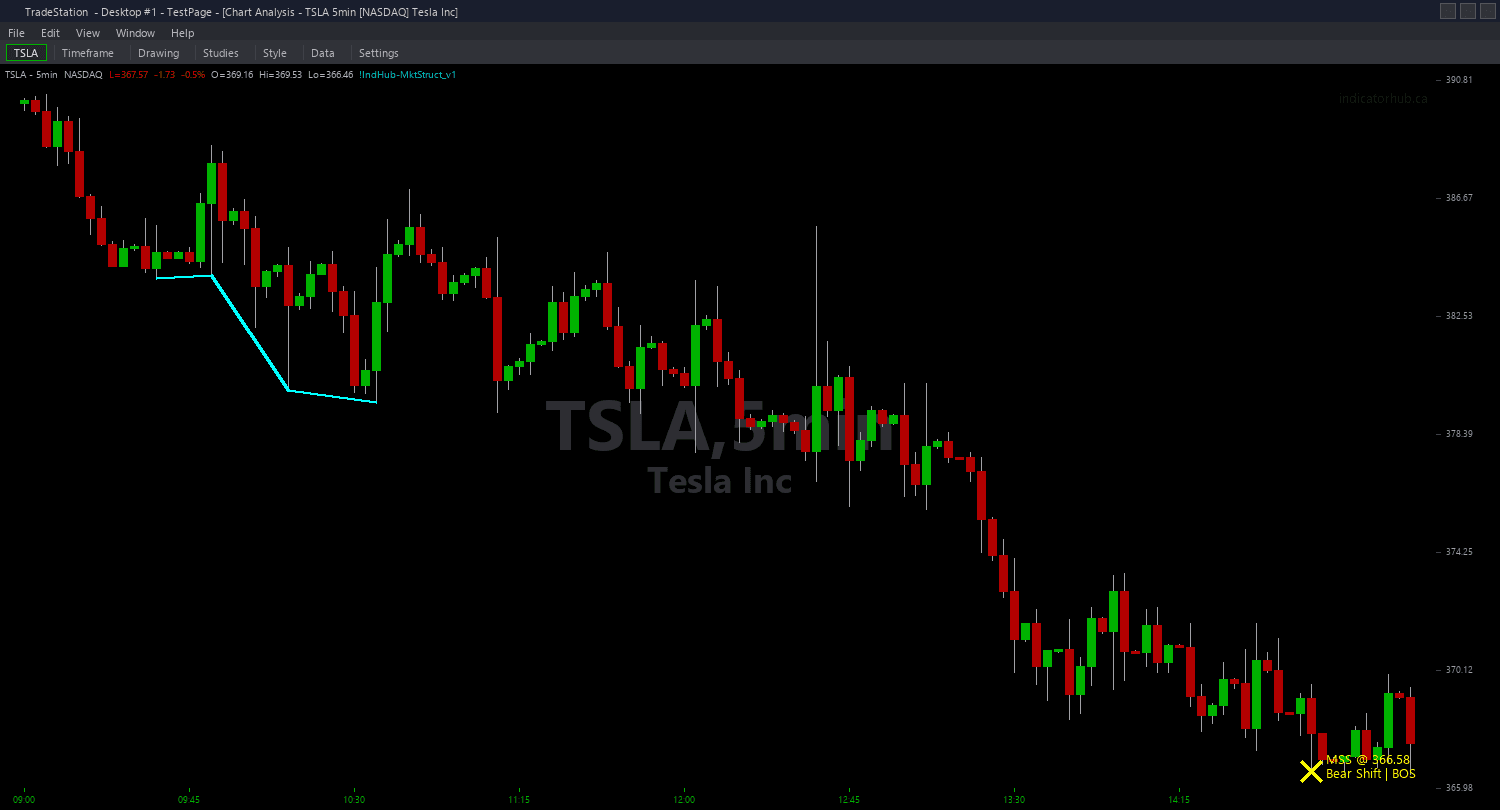
Example chart showing Market Structure ShowMe on a live trading session
Installation Guide
Step 1: Download the indicator file
After purchasing, you will receive a download link via email. Click the link and save the market-structure-showme.eld file to your computer. Save it somewhere easy to find like your Desktop or Downloads folder.
Step 2: Open the Import Wizard
Open TradeStation. Click the File menu in the top-left corner, then select Import/Export EasyLanguage to launch the Import/Export Wizard.

Step 3: Select the import type
In the Import/Export Wizard, select "Import EasyLanguage file (ELD, ELS or ELA)" from the list. Click Next to continue.

Step 4: Browse for the file
Click the Browse button to open a file browser where you can locate your downloaded .ELD file.

Step 5: Select and open the file
Navigate to the folder where you saved the .ELD file. Select market-structure-showme.eld and click Open. The file name shown may differ from the screenshot — look for your downloaded indicator file.

Step 6: Open the Studies menu
On your chart, click the Studies dropdown in the toolbar and select Add Study.

Step 7: Select the ShowMe study
In the Add Studies dialog, click the ShowMe tab on the left side. Find "!IndHub-SM_MktStructure_v1" in the list, select it, and click OK to apply.

Step 8: Configure settings (optional)
Right-click anywhere on the chart, go to Studies > Edit Studies..., select the indicator, and click the Inputs tab. Key inputs: SwingStrength (default 5), MaxLevels (default 10), MaxAge (default 75), ShowBOS (default true), ShowMSS (default true), DotOffset (default 0.3 ATR), ShowLabels (default false), AlertOnMSS (default true), AlertOnBOS (default false). For the cleanest view, set ShowBOS to false and ShowLabels to false.
Common Issues
I see both bright and light dots close together. What is happening?
Multiple structural breaks can occur in rapid succession during volatile markets. A bright green MSS dot followed quickly by a light green BOS dot means the trend reversed and immediately confirmed with a continuation break. This is actually a strong bullish signal — the structure shifted and immediately extended. Conversely, alternating bright green and bright red dots close together indicate choppy conditions with no sustained trend.
Can I show only MSS dots and hide BOS dots for a cleaner chart?
Yes. Set ShowBOS to false in the indicator inputs. Only MSS reversal dots (bright green and bright red) will appear. This is recommended for traders who only trade reversals and want the cleanest possible visual representation.
The dots appear several bars after the actual swing break. Is there a delay?
Structural breaks are detected on the bar where price closes beyond the swing level. There is no artificial delay — the dot appears on the exact bar where the close confirms the break. However, the swing level itself is only confirmed after SwingStrength bars on each side, so the level being broken was established several bars earlier. This is intentional for non-repainting accuracy.
For additional help, contact support.