VWAP Authority for RadarScreen
VWAP Authority for RadarScreen brings institutional reference levels to your watchlist, eliminating the need to open dozens of charts to check VWAP position and deviation bands. This RadarScreen version calculates VWAP with two standard deviation bands and tracks price behavior around these levels in sortable columns.
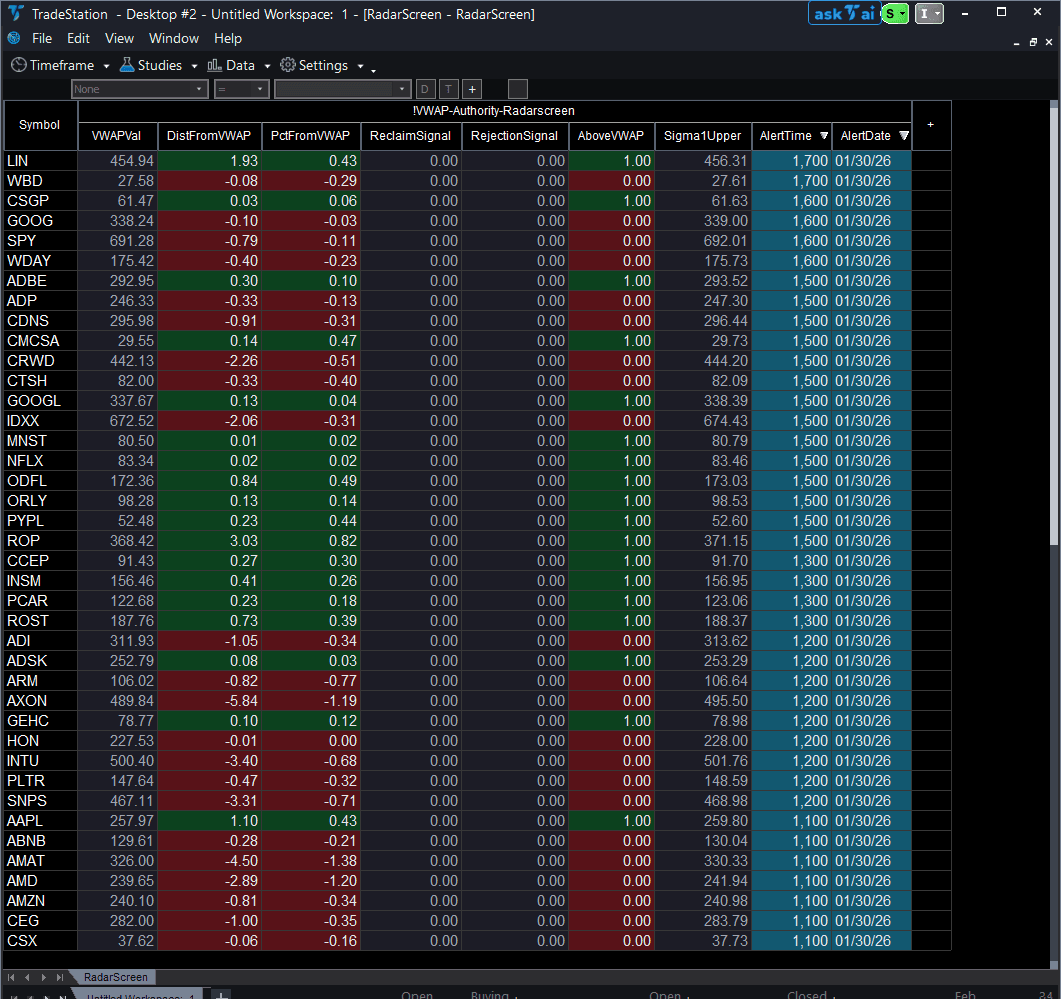
- ●Nine scannable columns: VWAP value, absolute and percentage distance from VWAP, reclaim and rejection signals, above/below flag, sigma band reference, plus Alert Date and Alert Time so you know exactly when each VWAP signal fired
- ●Sort by ReclaimSignal to catch symbols that just reclaimed VWAP after being below for 10+ bars
- ●Filter by RejectionSignal to spot symbols rejecting from upper deviation bands
- ●Check PctFromVWAP to find symbols stretched 2%+ away from VWAP for mean reversion opportunities
- ●Color-coded cells: green/red for above/below VWAP, yellow for reclaims, magenta for rejections
Use RadarScreen to find the 3-5 symbols showing VWAP signals, then switch to the VWAP Authority chart indicator (sold separately) for detailed band visualization and entry timing. Both use identical VWAP calculations and support daily, weekly, or monthly anchors.
All calculations use completed bar data only, ensuring signals never disappear on refresh. Non-repainting guaranteed.
Secure checkout powered by Stripe. No account required.
Who This Is For
Built for day traders and scalpers managing 15-50 symbol intraday watchlists who trade mean reversion or VWAP reclaim setups. Use real-time scanning during market hours to identify symbols showing VWAP reclaim momentum shifts or upper band rejection exhaustion, filtering your watchlist to 3-5 high-probability setups.
Add VWAP Authority RadarScreen to your intraday watchlist window (set interval to your trading timeframe). During the first 30 minutes after open (9:30-10:00 AM ET), sort by PctFromVWAP to find symbols with early extension. Monitor ReclaimSignal continuously for bullish momentum shifts. Check RejectionSignal when market rallies for exhaustion warnings.
Most effective during the first hour (9:30-10:30 AM ET) when VWAP is establishing and during mid-day (12:00-2:00 PM ET) for mean reversion setups. Avoid the final 15 minutes (3:45-4:00 PM ET) when closing volatility can produce false signals.
This RadarScreen indicator pairs with VWAP Authority Chart (sold separately). Use RadarScreen to filter your watchlist to 5 candidates showing reclaim or rejection signals, then switch to chart view for full VWAP bands, price action structure, and entry triggers. Both use the same VWAP calculation for seamless workflow.
See It in Action
Example chart showing VWAP Authority for RadarScreen on a live trading session

Example chart showing VWAP Authority for RadarScreen on a live trading session
Installation Guide
Step 1: Download the indicator file
After purchase, download vwap-authority-radarscreen.eld from your confirmation email or account download page. Save it to a location you will remember (Desktop or Downloads folder works well).
Step 2: Import into TradeStation
Open TradeStation. Go to File > Import > EasyLanguage Document. Browse to your downloaded .eld file and click Open. TradeStation will confirm successful import with a message listing VWAP Authority RS as imported. Click OK.

Step 3: Apply to RadarScreen
Open your RadarScreen window (or create new: View > RadarScreen). Right-click any column header and select Insert Indicator. In the indicator list, search for "VWAP Authority RS". Select it and click OK. TradeStation will add all seven plot columns (VWAPVal, DistFromVWAP, PctFromVWAP, ReclaimSignal, RejectionSignal, AboveVWAP, Sigma1Upper) to your RadarScreen.
Step 4: Configure your watchlist and columns
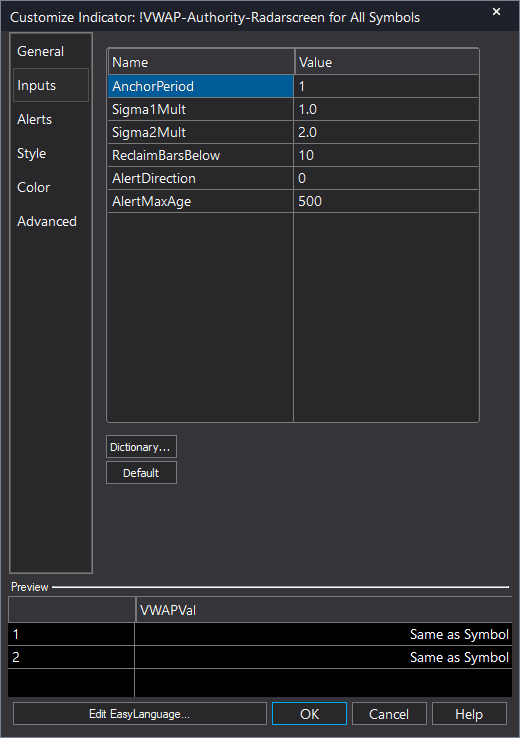
Add your symbols to the RadarScreen watchlist (type ticker and press Enter, or import from existing list). Adjust column widths by dragging column borders. To customize VWAP settings, right-click the indicator name in the column header area and select Format Indicator. Modify inputs: AnchorPeriod (1=Daily, 2=Weekly, 3=Monthly), Sigma1Mult and Sigma2Mult for band widths, ReclaimBarsBelow for reclaim signal sensitivity. Default settings (Daily anchor, 1.0/2.0 sigma multipliers, 10 bars below threshold) work well for intraday trading.
Full Color Customization
Every indicator ships with a professional dark color palette designed for extended trading sessions. But your workspace is yours — so we include a complete RGB Color Guide with every purchase that goes far beyond TradeStation's built-in color picker.
5 Ready-Made Palettes
Swap the entire look in minutes. Choose from Midnight Blue, Earth Tones, Neon Subdued, Grayscale, or Monochrome Green — each palette is tested for readability and eye comfort during long sessions.
70+ Individual Colors
Mix and match from a curated library of dark-optimized colors across greens, reds, blues, ambers, magentas, and neutrals. Every value is pre-tested to keep text readable on dark backgrounds.
Color Mixing Guide
Learn the RGB system with simple rules for making colors darker, warmer, cooler, or more muted. Build your own signature palette that matches your charts and workspace.
Copy-Paste Ready
Every color comes with the exact RGB code you need. Copy the value, paste it into the indicator source, done. No guessing, no trial and error.
Included free with every indicator purchase
Common Issues
VWAPVal shows 0.00 for some symbols. Why?
Zero VWAP means insufficient data has accumulated since the anchor reset. This happens at the very start of a new session (first bar after daily/weekly/monthly reset) or on symbols with no volume. Wait for at least 2-3 bars to accumulate after market open. For forex symbols (no volume data), VWAP uses tick count instead, which may initialize more slowly.
ReclaimSignal shows 1 but I don't see a bullish move on my chart. Is this a false signal?
ReclaimSignal fires when price crosses above VWAP after being below for the threshold number of bars (default 10). This is a momentum shift signal, not a guaranteed bullish move. Confirm the setup on your chart before entering. Also verify your RadarScreen interval matches your chart interval—a 5-minute reclaim won't show on a 15-minute chart the same way.
How do I filter my watchlist to show only symbols currently above VWAP?
Sort the AboveVWAP column descending (click header once). All symbols with value 1 (dark green cells) will appear at the top—these are above VWAP. Symbols with value 0 (dark red cells) are below VWAP and will sort to the bottom. Alternatively, use TradeStation's RadarScreen filtering features to hide rows where AboveVWAP = 0.
What's the difference between ReclaimSignal and simply crossing above VWAP?
ReclaimSignal requires price to have been below VWAP for at least ReclaimBarsBelow consecutive bars (default 10) before crossing above. This filters out choppy whipsaws around VWAP and identifies more meaningful momentum shifts. A simple cross above VWAP can happen every few bars in sideways action. Reclaim signals indicate sustained time below followed by a directional move back above—higher probability setup.
For additional help, contact support.