TTM Squeeze Pro for RadarScreen
TTM Squeeze Pro for RadarScreen brings squeeze detection to your watchlist scanning workflow, eliminating the need to open 20+ charts to check compression status. This RadarScreen version identifies when Bollinger Bands squeeze inside Keltner Channels and displays every symbol's compression state, momentum direction, and expansion signals in sortable columns.
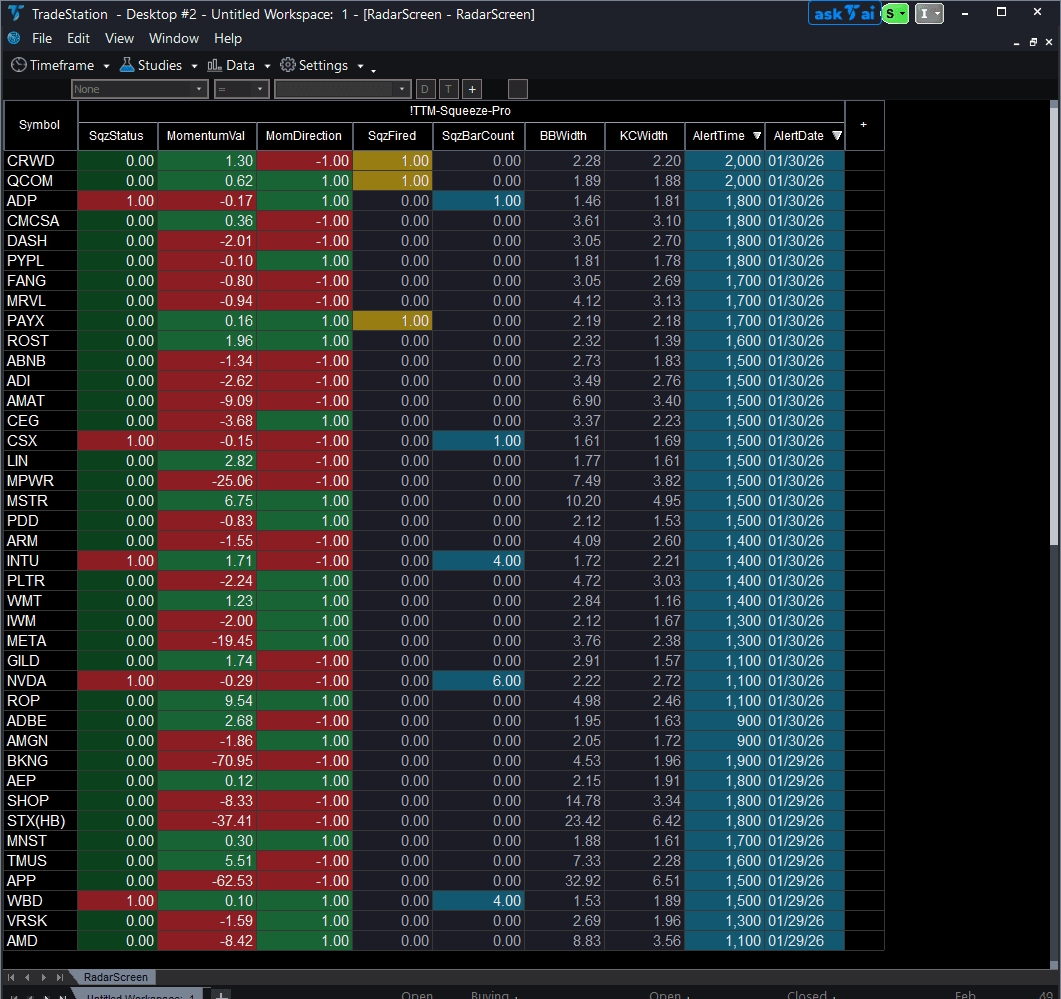
- ●Nine scannable columns: squeeze status, momentum value, momentum direction, squeeze-fired signal, consecutive bars in squeeze, BB/KC bandwidth measurements, plus Alert Date and Alert Time so you know exactly when each squeeze signal fired
- ●Sort by SqzFired to instantly see which symbols just broke out of compression
- ●Filter by SqzBarCount to find setups that have been building pressure for 15+ bars
- ●Color-coded cells make scanning effortless: red for active squeezes, yellow when a squeeze fires, green/red for momentum direction
- ●Works alongside the TTM Squeeze Pro chart indicator (sold separately) with identical squeeze logic
Sort by SqzBarCount descending to find symbols with the longest compression, then check momentum direction to know whether the expansion is bullish or bearish before you even open the chart. Use RadarScreen to find candidates, then switch to the chart version for detailed entry timing.
All signals use completed bar data only, ensuring you never see a squeeze fire signal that disappears on refresh. Non-repainting guaranteed.
Secure checkout powered by Stripe. No account required.
Who This Is For
Built for active day traders and swing traders managing 20-100 symbol watchlists who need to monitor multiple timeframes for volatility compression setups. Use pre-market and intraday scanning to identify symbols entering or exiting squeeze conditions, filtering large watchlists down to 3-5 high-probability candidates.
Add TTM Squeeze Pro RadarScreen to your main watchlist window. During your morning routine, sort by SqzBarCount descending to find symbols with the longest compression. During market hours, sort by SqzFired to catch expansion signals in real-time. Use MomentumVal and MomDirection columns to qualify directional bias.
Use pre-market (9:00-9:30 AM ET) for initial scan and setup identification. Monitor SqzFired column actively during the first hour (9:30-10:30 AM ET) when volatility expansions often occur. Re-scan during lunch (12:00-1:00 PM ET) to find afternoon setups.
This RadarScreen indicator pairs with TTM Squeeze Pro Chart (sold separately). Use RadarScreen to filter your watchlist down to 5 candidates, then switch to chart view for precise entry timing. Both use the same squeeze detection logic for seamless workflow.
See It in Action
Example chart showing TTM Squeeze Pro for RadarScreen on a live trading session

Example chart showing TTM Squeeze Pro for RadarScreen on a live trading session
Installation Guide
Step 1: Download the indicator file
After purchase, download ttm-squeeze-pro-radarscreen.eld from your confirmation email or account download page. Save it to a location you will remember (Desktop or Downloads folder works well).
Step 2: Import into TradeStation
Open TradeStation. Go to File > Import > EasyLanguage Document. Browse to your downloaded .eld file and click Open. TradeStation will confirm successful import with a message listing TTM Squeeze Pro RS as imported. Click OK.

Step 3: Apply to RadarScreen
Open your RadarScreen window (or create new: View > RadarScreen). Right-click any column header and select Insert Indicator. In the indicator list, search for "TTM Squeeze Pro RS". Select it and click OK. TradeStation will add all seven plot columns (SqzStatus, MomentumVal, MomDirection, SqzFired, SqzBarCount, BBWidth, KCWidth) to your RadarScreen.
Step 4: Configure your watchlist and columns
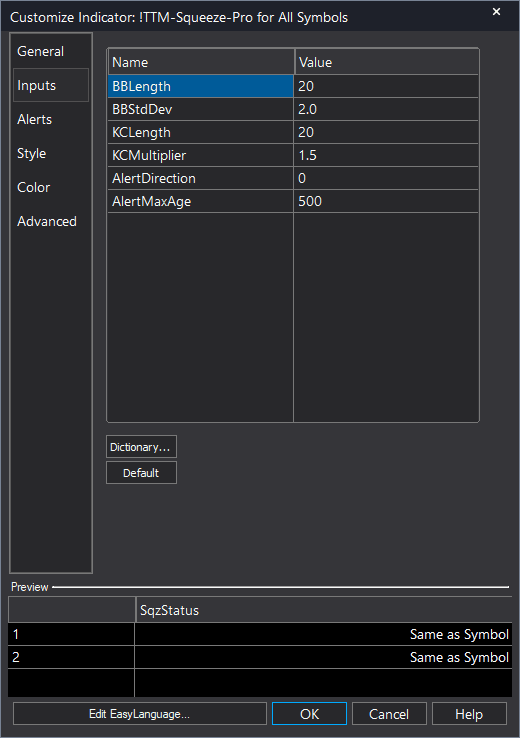
Add your symbols to the RadarScreen watchlist (type ticker and press Enter, or import from existing list). Adjust column widths by dragging column borders. To customize squeeze settings (BB/KC lengths), right-click the indicator name in the column header area and select Format Indicator. Modify inputs (BBLength, BBStdDev, KCLength, KCMultiplier) as needed. Default settings (BB: 20/2.0, KC: 20/1.5) work well for most traders.
Full Color Customization
Every indicator ships with a professional dark color palette designed for extended trading sessions. But your workspace is yours — so we include a complete RGB Color Guide with every purchase that goes far beyond TradeStation's built-in color picker.
5 Ready-Made Palettes
Swap the entire look in minutes. Choose from Midnight Blue, Earth Tones, Neon Subdued, Grayscale, or Monochrome Green — each palette is tested for readability and eye comfort during long sessions.
70+ Individual Colors
Mix and match from a curated library of dark-optimized colors across greens, reds, blues, ambers, magentas, and neutrals. Every value is pre-tested to keep text readable on dark backgrounds.
Color Mixing Guide
Learn the RGB system with simple rules for making colors darker, warmer, cooler, or more muted. Build your own signature palette that matches your charts and workspace.
Copy-Paste Ready
Every color comes with the exact RGB code you need. Copy the value, paste it into the indicator source, done. No guessing, no trial and error.
Included free with every indicator purchase
Common Issues
All columns show zeros or dashes for certain symbols. Why?
RadarScreen indicators need sufficient historical data to calculate. TTM Squeeze Pro requires at least 20 bars (the default BBLength/KCLength). Newly listed symbols or low-volume pre-market stocks may not have enough data. Wait for more bars to accumulate, or reduce BBLength/KCLength to 10 if you need faster initialization (though this reduces accuracy).
SqzFired column flashes yellow but I don't see the expansion on my chart indicator. Which is correct?
Both are correct—you may be comparing different timeframes. RadarScreen calculates on the timeframe set in the RadarScreen interval selector (bottom-right corner). If your RadarScreen is set to 5-minute but your chart is on 15-minute, they'll show different squeeze states. Match the intervals or understand that they're tracking different compression cycles.
How do I sort by SqzFired to see only symbols with active expansion signals?
Click the SqzFired column header once to sort descending (symbols with value 1 will appear at top). The yellow cell background makes them easy to spot. Note that SqzFired = 1 only appears on the exact bar the squeeze fires, then resets to 0 on the next bar. If you don't see any yellow cells, no expansions have occurred on the most recent completed bar.
Can I hide columns I don't use, like BBWidth and KCWidth?
Yes. Right-click the column header for any plot you want to hide and select Hide Column. This doesn't remove the indicator—just hides that specific plot. To show it again, right-click the indicator name in the header area, select Format Indicator, go to the Plots tab, and re-enable visibility for the hidden plot.
For additional help, contact support.