Order Blocks
Order Blocks reveals exactly where large institutions placed their orders before major price moves, giving you high-probability support and resistance zones that retail traders miss. This chart overlay identifies the last opposing candle before an impulsive breakout and draws those zones directly on your price chart as horizontal rectangles.
- ●Bullish order blocks (green zones) mark where institutions accumulated before a breakout, acting as support when price returns
- ●Bearish order blocks (red zones) mark where institutions went short before a breakdown, creating resistance on future rallies
- ●Zones extend forward in time so you can watch price action as it approaches decision points
- ●Automatic zone mitigation removes invalidated zones when price closes through them, keeping your chart clean
- ●Alignment status plots green when price is inside a bullish zone, red inside a bearish zone, and white when outside all zones
When price returns to an active order block, you get a high-quality setup: either the zone holds and provides an entry with tight risk, or price closes through the zone and invalidates it, keeping you out of losing trades. The indicator uses confirmed swing highs and swing lows over a 5-bar window to identify market structure breaks with zero subjectivity.
Every zone is guaranteed non-repainting. Once an order block draws on your chart, it remains anchored to the exact candle that created it and will never disappear or move retroactively.
Secure checkout powered by Stripe. No account required.
Who This Is For
Order Blocks is built for swing traders and position traders who want to enter near institutional levels with defined risk instead of chasing moves after they already ran. If you have been frustrated by support and resistance lines that seem arbitrary, or if you want to know where the big money is positioned, this indicator gives you objective zones based on actual market structure breaks.
Use it for planning entries when price pulls back to key levels. During a strong uptrend, wait for price to retrace into a bullish order block zone and watch for rejection wicks or bullish reversal patterns. During a downtrend, wait for rallies into bearish order blocks and look for resistance confirmation.
Works best on higher timeframes where institutional footprints are clearest: 15-minute charts for day trading, 1-hour and 4-hour charts for swing trading, and daily charts for position trading. Most effective on liquid markets with clear trending structure: index futures, major currency pairs, large-cap stocks, and established crypto assets.
Mark your order block zones and set alerts. When price approaches a zone, watch for confirmation: bullish patterns at green zones, bearish patterns at red zones. Enter in the direction of the zone bias with your stop just beyond the zone boundary.
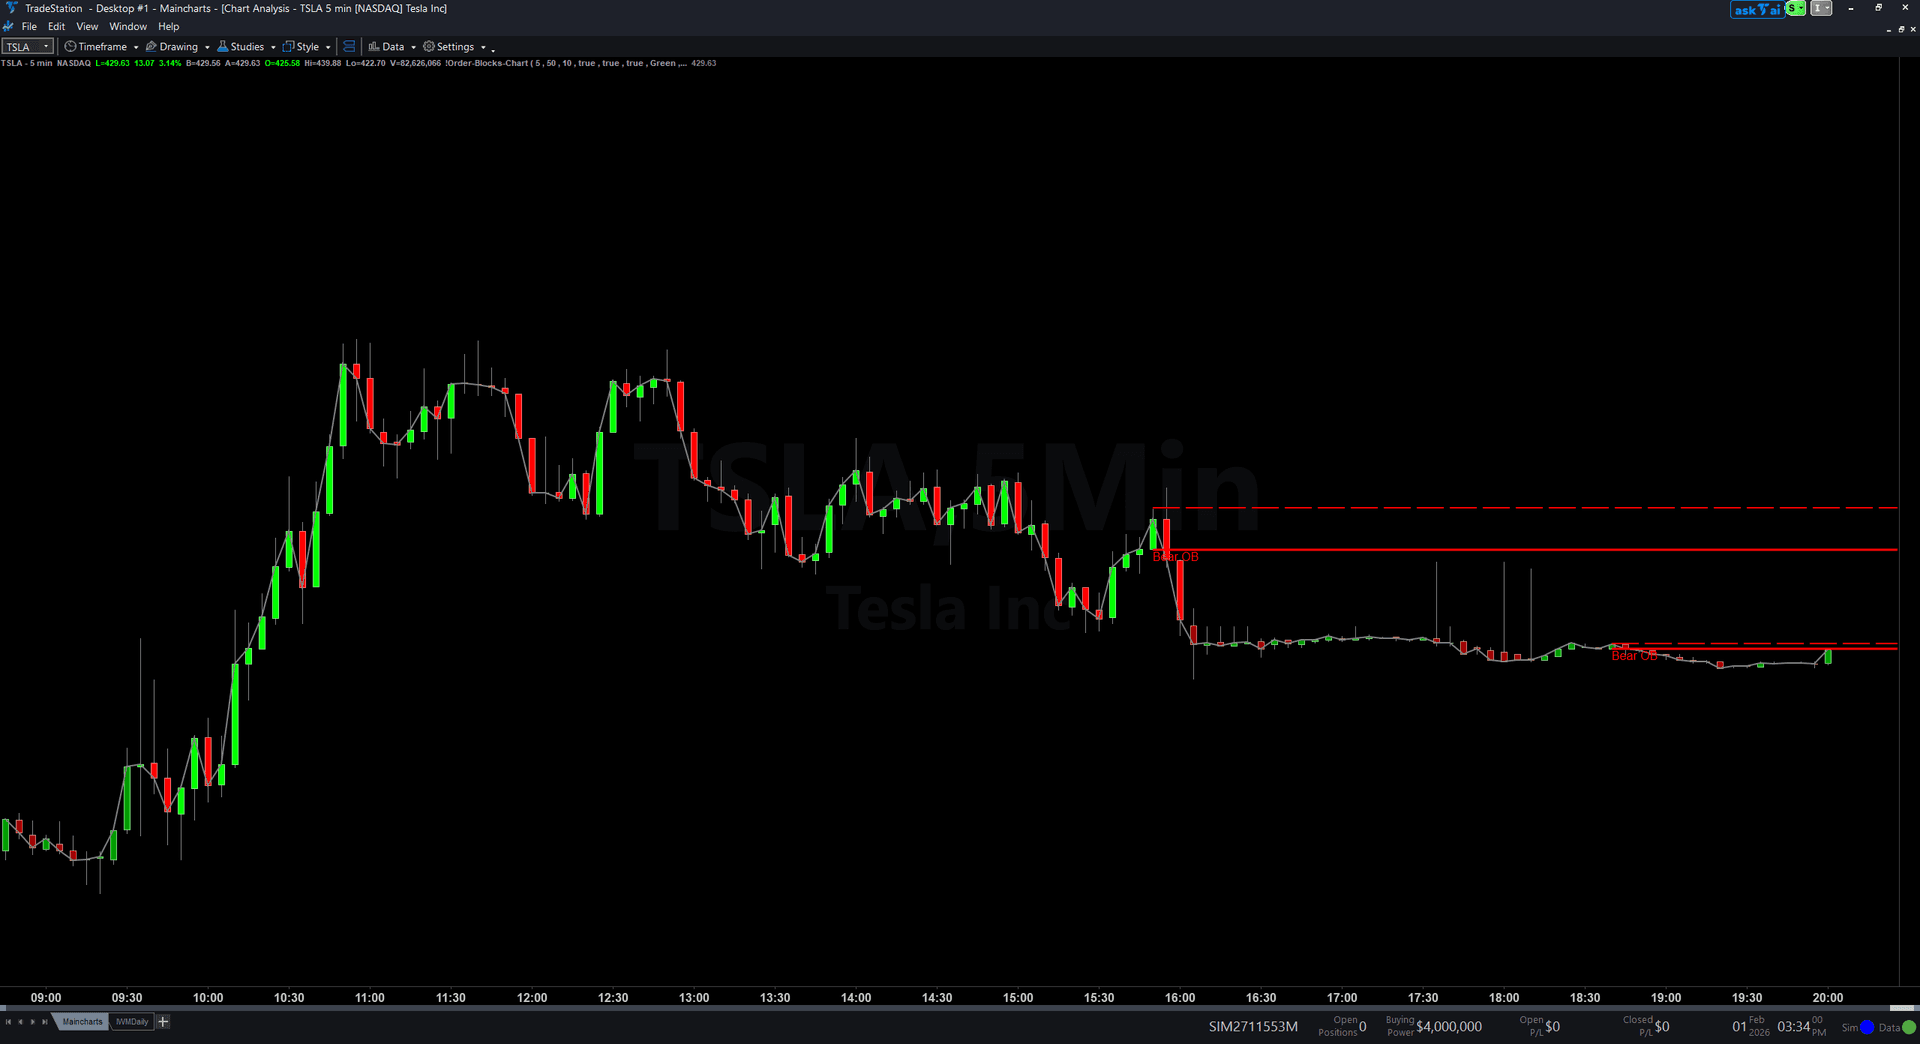
See It in Action
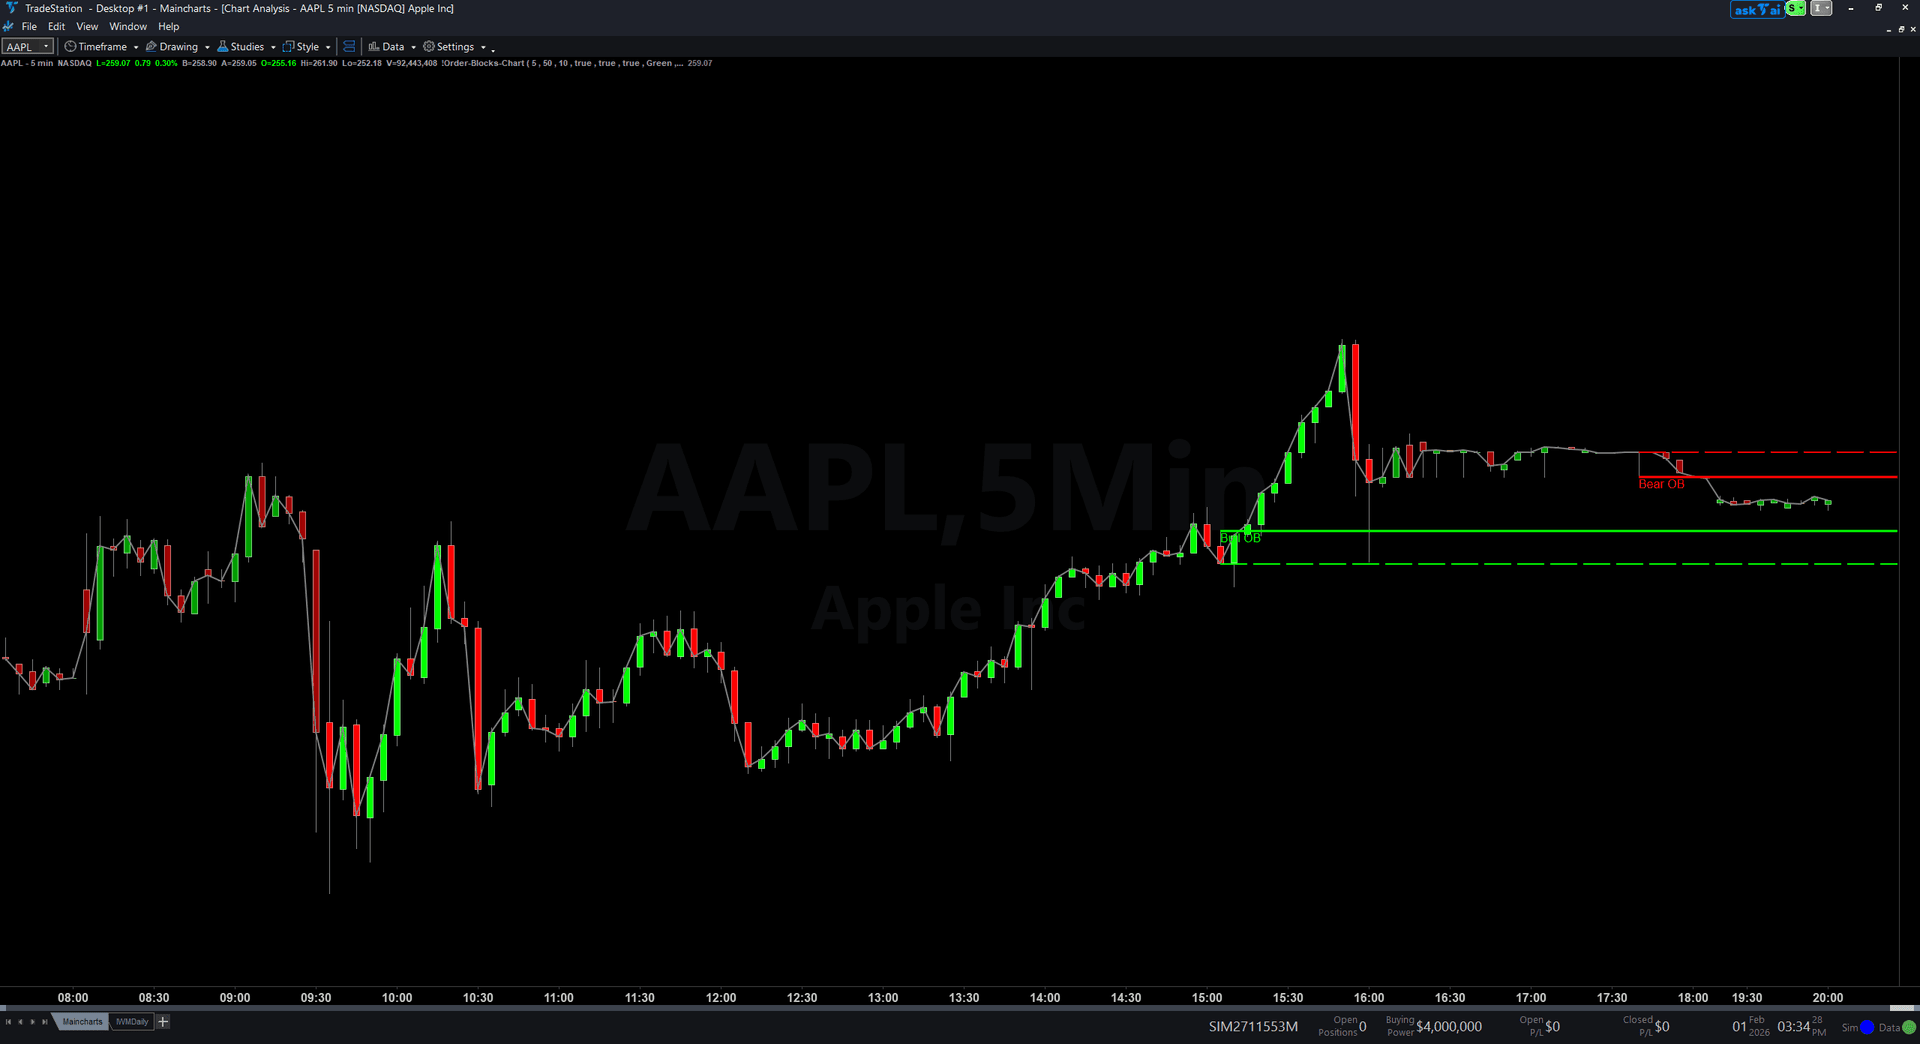
Example chart showing Order Blocks on a live trading session

Example chart showing Order Blocks on a live trading session
Installation Guide
Step 1: Download the indicator file
After purchasing, you will receive a download link via email. Click the link and save the Order_Blocks.ELD file to your computer. This file contains the complete indicator ready to import into TradeStation.
Step 2: Import into TradeStation
Open TradeStation and go to File > Import > EasyLanguage. In the import dialog, click Browse and navigate to the location where you saved the Order_Blocks.ELD file. Select the file and click Open. TradeStation will confirm the import was successful. Click OK.

Step 3: Apply to your chart
Open any chart in TradeStation. Right-click on the chart and select Insert Analysis Technique. In the list of indicators, search for "Order Blocks" and select it. Click OK to apply. The indicator will draw order block zones directly on your price chart as horizontal rectangles extending to the right.
Step 4: Configure settings (optional)
Right-click the indicator name in the chart legend and select Format [IndicatorName]. On the Inputs tab, you can customize: SwingStrength (default 5): Number of bars on each side required to confirm a swing pivot. Higher values find stronger pivots but fewer zones. MaxOBAge (default 50): Maximum bars an order block can persist without being tested before expiring. MaxOBCount (default 10): Maximum number of simultaneous order blocks tracked per direction. ShowBullishOB (default true): Enable or disable drawing of bullish order block zones. ShowBearishOB (default true): Enable or disable drawing of bearish order block zones. BullColor (default Green): Color for bullish order block zones. BearColor (default Red): Color for bearish order block zones. AlertOnNewOB (default true): Enable audio alert when a new order block is identified. Click OK to save your changes. The indicator will redraw zones with your chosen settings.
Full Color Customization
Every indicator ships with a professional dark color palette designed for extended trading sessions. But your workspace is yours — so we include a complete RGB Color Guide with every purchase that goes far beyond TradeStation's built-in color picker.
5 Ready-Made Palettes
Swap the entire look in minutes. Choose from Midnight Blue, Earth Tones, Neon Subdued, Grayscale, or Monochrome Green — each palette is tested for readability and eye comfort during long sessions.
70+ Individual Colors
Mix and match from a curated library of dark-optimized colors across greens, reds, blues, ambers, magentas, and neutrals. Every value is pre-tested to keep text readable on dark backgrounds.
Color Mixing Guide
Learn the RGB system with simple rules for making colors darker, warmer, cooler, or more muted. Build your own signature palette that matches your charts and workspace.
Copy-Paste Ready
Every color comes with the exact RGB code you need. Copy the value, paste it into the indicator source, done. No guessing, no trial and error.
Included free with every indicator purchase
Common Issues
I see too many order blocks on my chart and it looks cluttered. How do I reduce them?
Increase the SwingStrength input to 7 or 10. This requires more bars to confirm a swing pivot, which results in fewer but higher-quality order blocks. You can also reduce MaxOBCount to limit the number of simultaneous zones displayed. Setting it to 5 per direction keeps only the most recent zones visible.
An order block disappeared from my chart. Why?
Order blocks are removed under two conditions: mitigation (price closed through the zone) or expiration (the zone aged beyond MaxOBAge bars without being tested). This is intentional. Failed zones are removed to keep your chart focused on only the currently valid institutional levels. If you want zones to persist longer, increase the MaxOBAge setting.
Can I use this on 1-minute or 5-minute charts?
Yes, the indicator works on any timeframe. However, order blocks are most reliable on higher timeframes where institutional activity is more evident. On very low timeframes like 1-minute charts, you will see many small zones that may not carry the same institutional significance. For best results, use 15-minute or higher timeframes.
The zones look too wide. Can I make them thinner?
Order blocks represent the full high-to-low range of the candle that created them, which accurately reflects the institutional zone. If a zone seems too wide for your risk tolerance, use a higher SwingStrength setting. This will identify only the strongest structure breaks, which tend to produce tighter, more precise zones. You can also use a higher timeframe where candle ranges consolidate into cleaner zones.
Can I see order blocks from higher timeframes on my current chart?
TradeStation does not support multi-timeframe indicators directly. To reference order blocks from a higher timeframe, open a second chart with the higher timeframe and apply Order Blocks there. You can then manually draw reference lines on your lower timeframe chart, or keep both charts visible side-by-side for context.
For additional help, contact support.