
Inverse Fair Value Gap ShowMe
Inverse Fair Value Gap ShowMe marks the precise moment price enters an IFVG zone for a retest — the entry signal for trading polarity-flipped FVG zones. Green dots appear above bars entering bullish IFVG zones (former bearish FVGs that flipped to demand). Red dots appear below bars entering bearish IFVG zones (former bullish FVGs that flipped to supply).
- ●Green dots ABOVE the bar mark the first bar entering a bullish IFVG zone — potential long entry at the polarity-flipped demand level
- ●Red dots BELOW the bar mark the first bar entering a bearish IFVG zone — potential short entry at the polarity-flipped supply level
- ●Dots only plot on the FIRST bar of each zone visit — subsequent bars inside the same IFVG zone do not trigger additional dots, keeping your chart clean
- ●If price exits the IFVG zone and re-enters later, a new dot appears on the re-entry bar
- ●DotOffset (default 0.3 ATR) controls dot placement distance from the price bar for readability
- ●Optional text labels display the original FVG age and IFVG size for context at each signal
- ●Uses the same two-stage detection engine — all MinGapATR, MaxIFVGAge, MaxOrigFVGCount, and MaxOrigFVGAge inputs are shared
The retest signal is the actionable output: when a dot appears, price has returned to a polarity-flipped FVG zone. Combine with the chart indicator to see the full zone boundaries and CE midpoint for precise stop and target placement.
All signals are guaranteed non-repainting. Once a dot plots on a completed bar, it will never disappear.
30-Day Money-Back Guarantee
Try it risk-free. Not satisfied? Full refund, no questions asked.
Part of the Inverse Fair Value Gap Bundle
Get all 4 study types for $65 — save $30
Who This Is For
Inverse Fair Value Gap ShowMe is designed for advanced SMC traders who want clean, unambiguous signals when price returns to polarity-flipped FVG zones. Instead of watching zone boundaries and guessing when a retest begins, the dot tells you the exact bar.
Layer this study on top of the Inverse FVG chart indicator. The chart indicator shows where IFVG zones are and their CE midpoints; the ShowMe dots tell you when price has arrived at those zones. First retests of fresh IFVGs are the highest-probability setups.
Use it on 5-minute to 15-minute charts for intraday retest entries. When a green dot appears, price has entered a bullish IFVG — evaluate for a long entry with a stop below the zone low. When a red dot appears, evaluate for a short with a stop above the zone high. Always confirm with the higher-timeframe trend direction.
Works on any liquid market. Best results on index futures, large-cap stocks, and high-volume ETFs where the two-stage FVG-to-IFVG lifecycle plays out with genuine institutional backing.
See It in Action
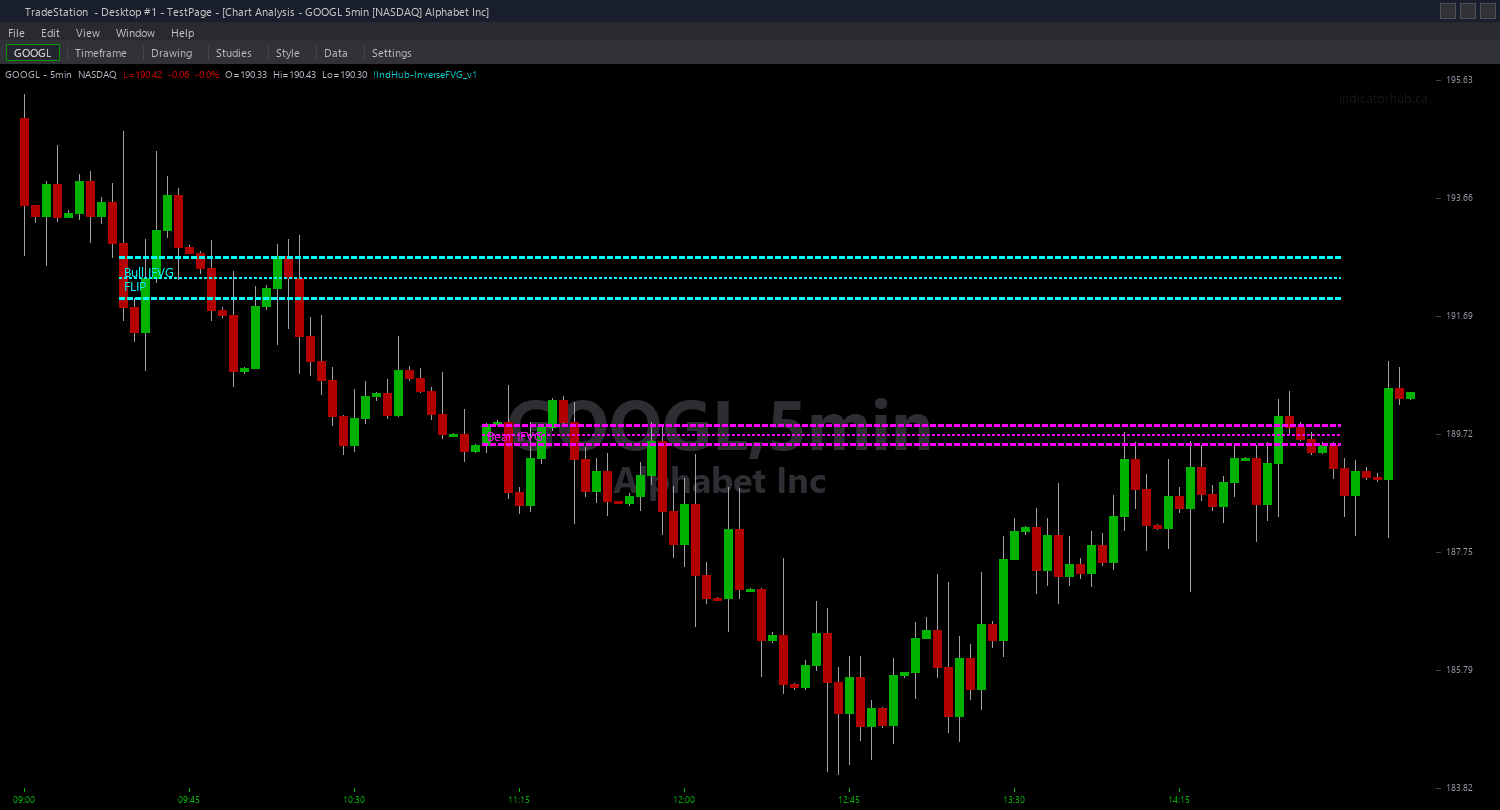
Example chart showing Inverse Fair Value Gap ShowMe on a live trading session
Installation Guide
Step 1: Download the indicator file
After purchasing, you will receive a download link via email. Click the link and save the inverse-fvg-showme.eld file to your computer. Save it somewhere easy to find like your Desktop or Downloads folder.
Step 2: Open the Import Wizard
Open TradeStation. Click the File menu in the top-left corner, then select Import/Export EasyLanguage to launch the Import/Export Wizard.

Step 3: Select the import type
In the Import/Export Wizard, select "Import EasyLanguage file (ELD, ELS or ELA)" from the list. Click Next to continue.

Step 4: Browse for the file
Click the Browse button to open a file browser where you can locate your downloaded .ELD file.

Step 5: Select and open the file
Navigate to the folder where you saved the .ELD file. Select inverse-fvg-showme.eld and click Open. The file name shown may differ from the screenshot — look for your downloaded indicator file.

Step 6: Open the Studies menu
On your chart, click the Studies dropdown in the toolbar and select Add Study.

Step 7: Select the ShowMe study
In the Add Studies dialog, click the ShowMe tab on the left side. Find "!IndHub-SM_InverseFVG_v1" in the list, select it, and click OK to apply.

Step 8: Configure settings (optional)
Right-click anywhere on the chart, go to Studies > Edit Studies..., select the indicator, and click the Inputs tab. Key inputs: MinGapATR (default 0.1), MaxIFVGAge (default 100), MaxOrigFVGCount (default 10), MaxOrigFVGAge (default 200), DotOffset (default 0.3 ATR), AlertOnRetest (default true). For dot appearance, go to the Plots tab and set the plot style to Point with your preferred weight.
Common Issues
I see very few dots on my chart. Is the indicator working?
The ShowMe only plots dots on the first bar entering an IFVG zone, and IFVG zones themselves are rare because they require the two-stage detection (FVG formation then full mitigation). Few signals is expected behavior for this advanced concept. Increase MaxOrigFVGCount and MaxOrigFVGAge to track more original FVGs for longer, or lower MinGapATR to include smaller original gaps in the mitigation pipeline.
A dot appeared but price did not react at the IFVG zone. Is the signal wrong?
The dot marks zone entry, not a guaranteed reaction. Not every IFVG retest produces a bounce or rejection. Use the dot as an alert to evaluate the setup — check the CE midpoint, volume, candle patterns, and higher-timeframe trend alignment before entering. IFVGs that align with the dominant trend direction have the highest success rate.
Can I use the ShowMe without the main chart indicator?
Yes. The ShowMe runs the full two-stage detection engine internally and works independently. However, using it alongside the chart indicator gives you the full picture: the chart indicator shows IFVG zone boundaries and the CE midpoint for stop/target placement, and the ShowMe marks the exact retest entry bar.
For additional help, contact support.