EMA Stack for Charts
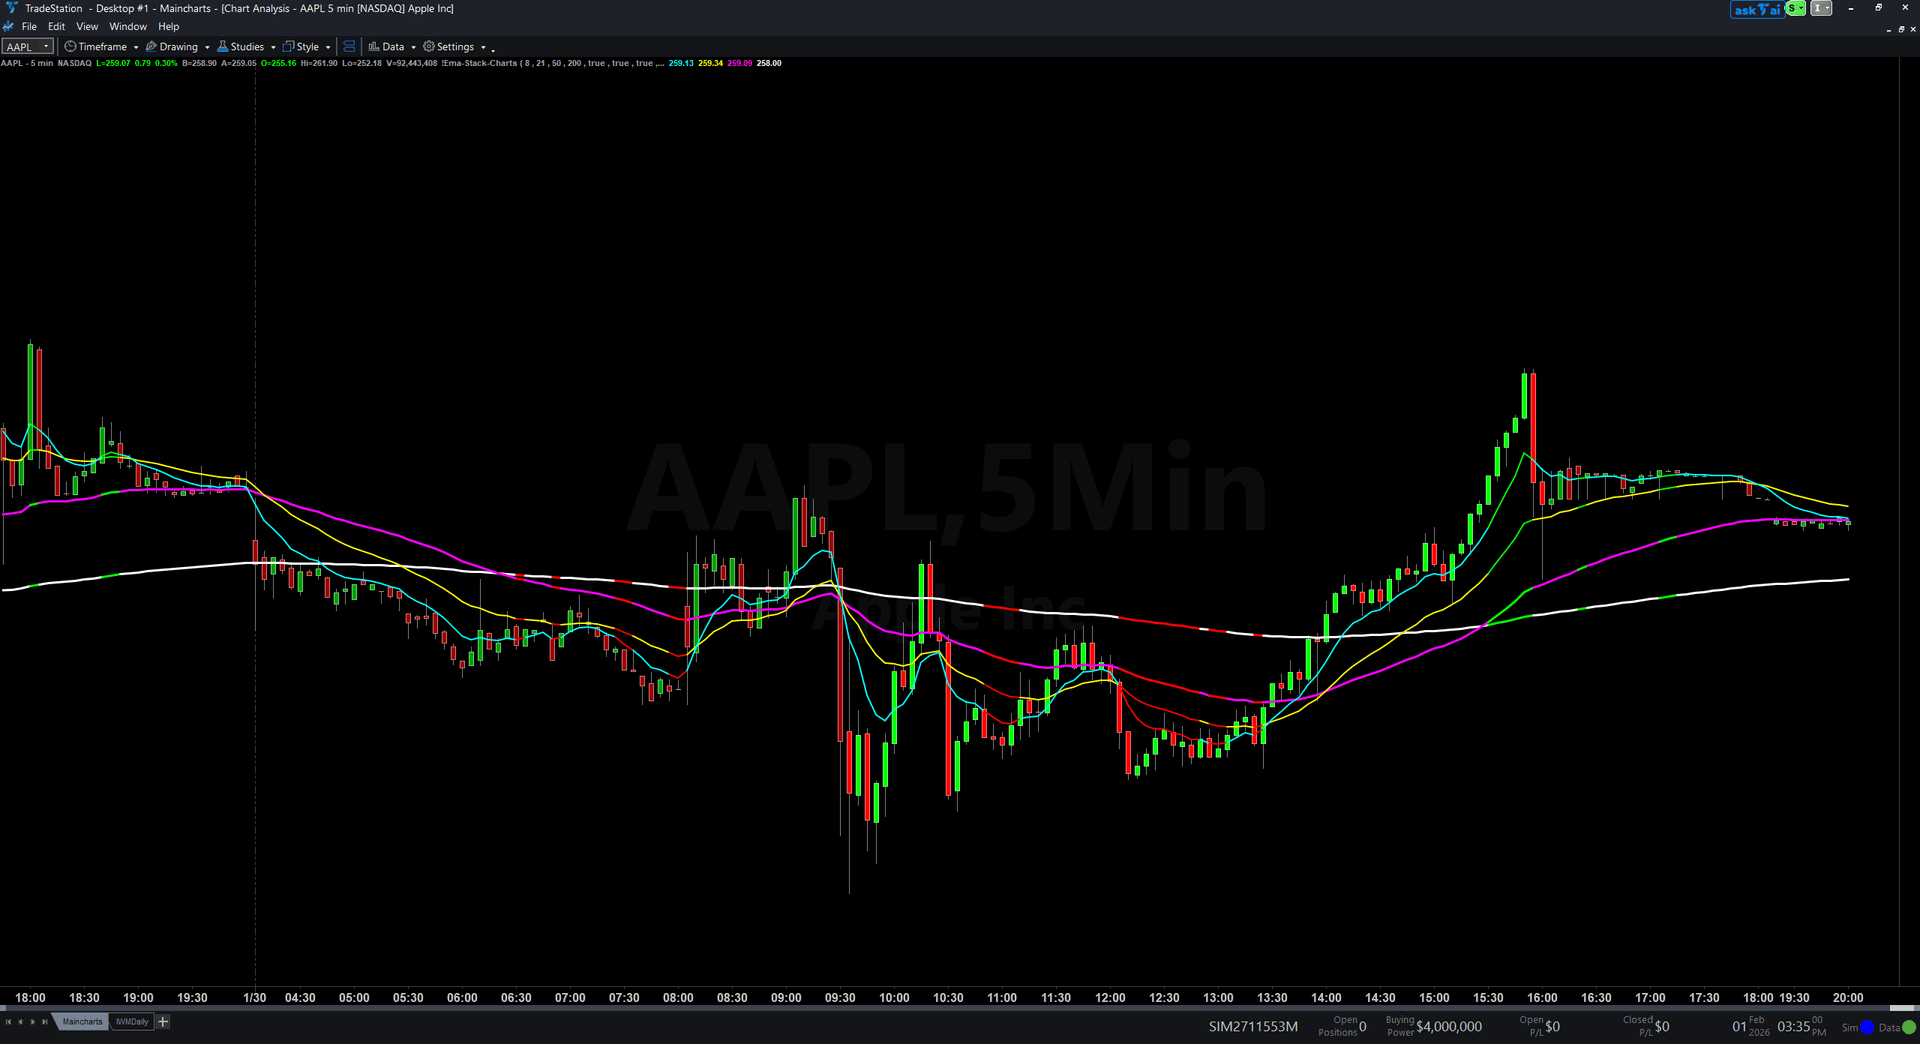
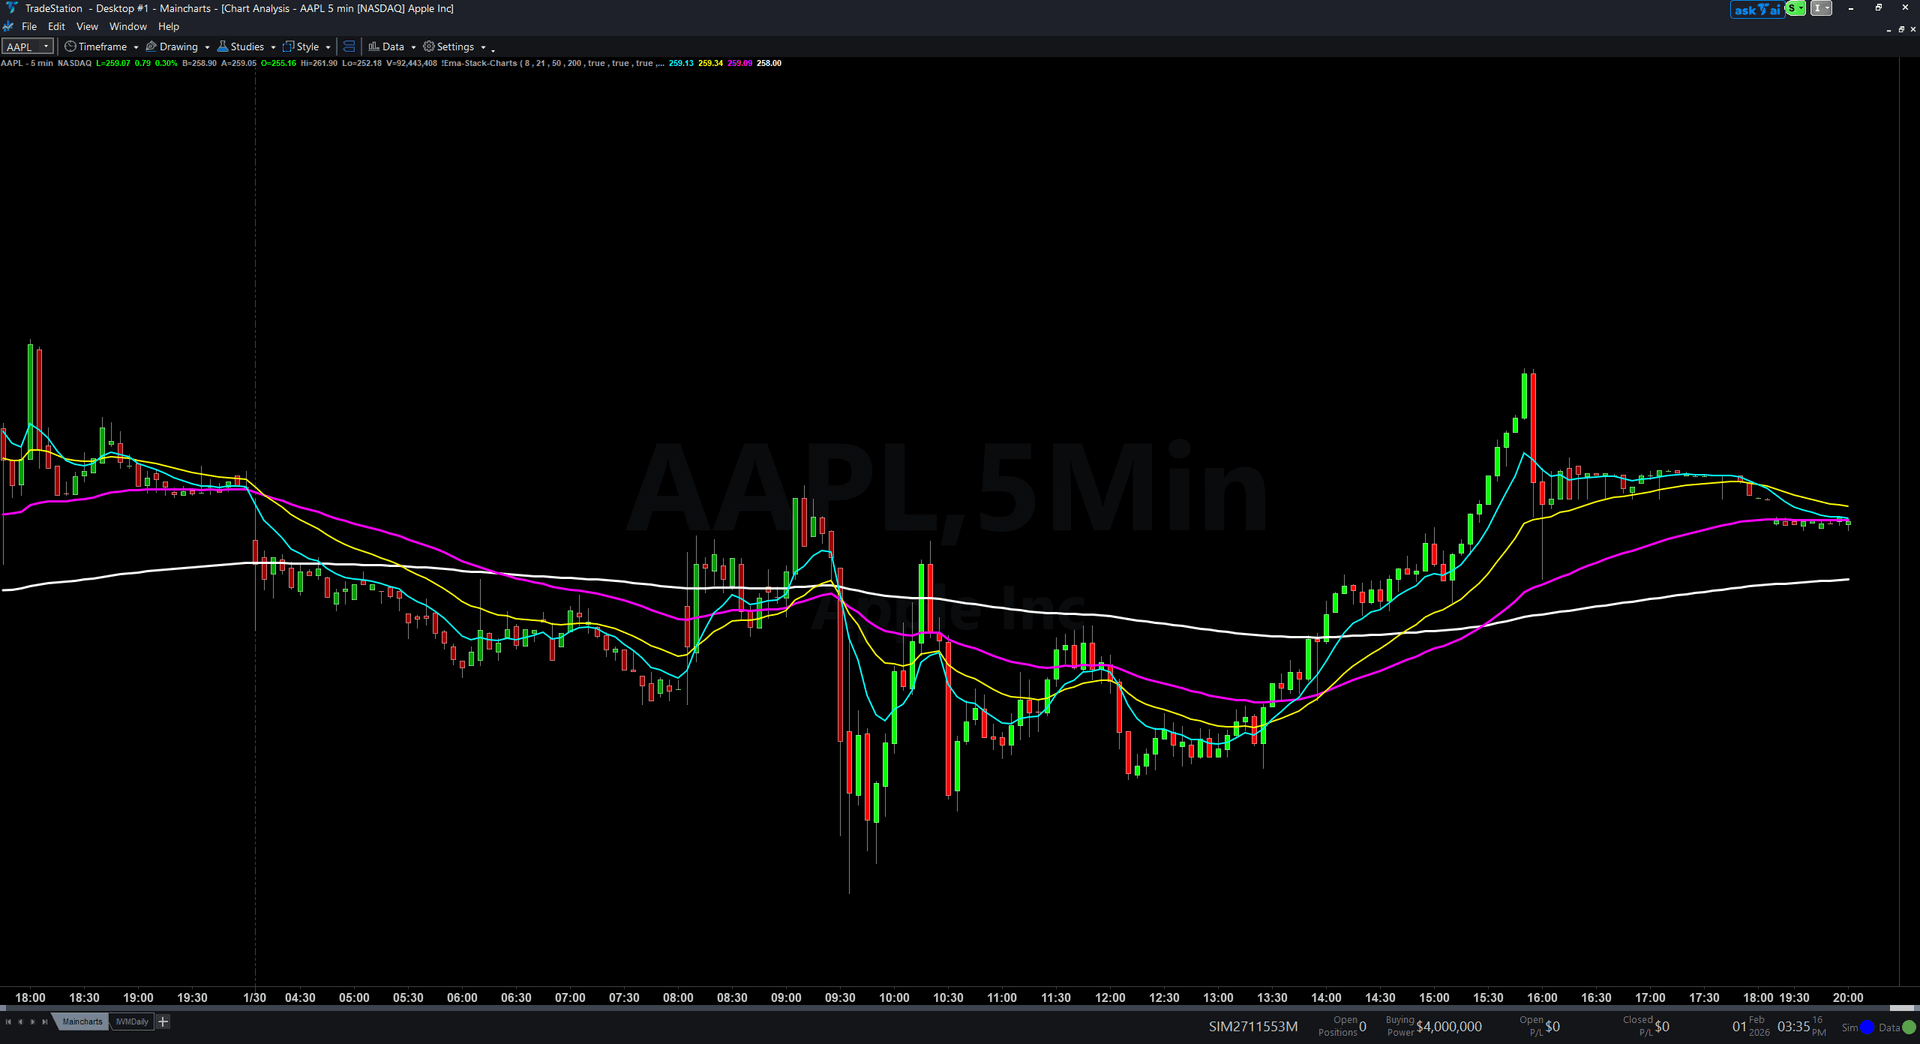
EMA Stack Chart eliminates the guesswork of trend analysis by showing you exactly when all four key exponential moving averages align in perfect trending order and when they are tangled in choppy conditions. The indicator plots EMA 8, 21, 50, and 200 directly on your price chart with color-coding and visual hierarchy, plus a TrendScore from -100 to +100 that quantifies trend strength.
- ●EMA 8 (cyan, thin) reacts fastest to price changes for immediate momentum reading
- ●EMA 21 (yellow, thin) confirms short-term momentum direction
- ●EMA 50 (magenta, medium) defines the intermediate trend
- ●EMA 200 (white, thick) anchors the long-term structural direction
- ●TrendScore scores five factors: stack alignment, directional movement, price position, fan-out dynamics, and volume confirmation
- ●When TrendScore exceeds +60, price bars paint green; below -60, bars paint red for instant visual confirmation
Perfect trend alignment means price is above all four EMAs with EMA 8 on top, then 21, then 50, then 200 on the bottom. When you see this perfect stack with green bar coloring, you are in a high-probability trending environment where pullbacks to the EMAs offer low-risk entries. When EMAs tangle and cross, step aside and wait for alignment to return.
All calculations use completed bar data only. Non-repainting guaranteed, so your backtests reflect exactly what you would have seen in real time.
Secure checkout powered by Stripe. No account required.
Who This Is For
EMA Stack Chart is built for swing traders and position traders who want a systematic, objective way to identify trending markets and avoid getting chopped up in sideways conditions. If you have been frustrated by false breakouts or whipsaw trades, the EMA stack gives you a visual framework to confirm genuine trending conditions before committing capital.
Use it for trade filtering and entry timing. In a perfect bullish stack, look for pullbacks to the EMA 8 or EMA 21 as low-risk long entries. In a perfect bearish stack, look for rallies to the EMAs as short entries. When the EMAs are tangled, reduce position size or step aside entirely.
Works on any timeframe, but most effective on higher timeframes where EMA alignment carries more weight. Use 1-hour and 4-hour charts for swing trading. Use daily and weekly charts for position trading and long-term trend confirmation. Most reliable on liquid trending markets: index futures, large-cap stocks, major forex pairs, and crypto assets with sustained directional moves.
Watch for perfect stack alignment and green or red bar coloring. Enter in the direction of the stack when price pulls back to one of the faster EMAs. Use the EMA 200 as your major trend filter: only take long setups when price is above EMA 200, and only take short setups when price is below EMA 200.
See It in Action
Example chart showing EMA Stack for Charts on a live trading session
Example chart showing EMA Stack for Charts on a live trading session
Installation Guide
Step 1: Download the indicator file
After purchasing, you will receive a download link via email. Click the link and save the EMA_Stack_Chart.ELD file to your computer. This file contains the complete indicator ready to import into TradeStation.
Step 2: Import into TradeStation
Open TradeStation and go to File > Import > EasyLanguage. In the import dialog, click Browse and navigate to the location where you saved the EMA_Stack_Chart.ELD file. Select the file and click Open. TradeStation will confirm the import was successful. Click OK.

Step 3: Apply to your chart
Open any chart in TradeStation. Right-click on the chart and select Insert Analysis Technique. In the list of indicators, search for "EMA Stack Chart" and select it. Click OK to apply. The indicator will draw four colored EMA lines directly on your price chart. If ColorBars is enabled (default), you will also see green and red bar coloring during strong trend periods.
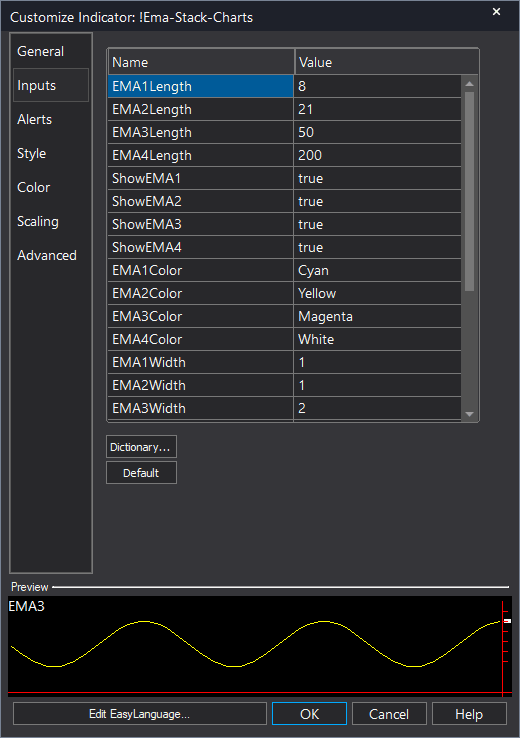
Step 4: Configure settings (optional)
Right-click the indicator name in the chart legend and select Format [IndicatorName]. On the Inputs tab, you can customize: EMA1Length (default 8): Period for the fast EMA. Common alternatives are 5 or 10. EMA2Length (default 21): Period for the medium EMA. Some traders prefer 20 or 25. EMA3Length (default 50): Period for the slow EMA. Standard is 50. EMA4Length (default 200): Period for the anchor EMA. Standard is 200. VolAvgLength (default 50): Lookback period for average volume calculation used in TrendScore. ColorBars (default true): Enable bar coloring for strong trend regimes. Set to false to show only the EMA lines without painting bars. Click OK to save your changes. The indicator will redraw the EMA lines with your chosen periods.
Full Color Customization
Every indicator ships with a professional dark color palette designed for extended trading sessions. But your workspace is yours — so we include a complete RGB Color Guide with every purchase that goes far beyond TradeStation's built-in color picker.
5 Ready-Made Palettes
Swap the entire look in minutes. Choose from Midnight Blue, Earth Tones, Neon Subdued, Grayscale, or Monochrome Green — each palette is tested for readability and eye comfort during long sessions.
70+ Individual Colors
Mix and match from a curated library of dark-optimized colors across greens, reds, blues, ambers, magentas, and neutrals. Every value is pre-tested to keep text readable on dark backgrounds.
Color Mixing Guide
Learn the RGB system with simple rules for making colors darker, warmer, cooler, or more muted. Build your own signature palette that matches your charts and workspace.
Copy-Paste Ready
Every color comes with the exact RGB code you need. Copy the value, paste it into the indicator source, done. No guessing, no trial and error.
Included free with every indicator purchase
Common Issues
The EMA lines are tangled and crossing constantly. Is the indicator broken?
No. When EMAs are tangled, it means the market is in a choppy, non-trending state. This is valuable information. It tells you to avoid trend-following strategies and either trade mean reversion setups or step aside entirely. The indicator is working correctly by visually showing you the market lacks directional alignment.
The bars are not painting green or red even though the EMAs look aligned. Why?
Bar coloring only activates when TrendScore exceeds +60 (green) or drops below -60 (red). This requires not just stack alignment but also all EMAs rising or falling, price positioned correctly, fan-out, and volume confirmation. If only some conditions are met, TrendScore may be +40 or +50, which is not enough to trigger bar coloring. This is intentional to ensure bar painting only highlights the strongest trending regimes.
Can I use different EMA periods like 9, 20, 50, 200?
Yes. Adjust the EMA1Length, EMA2Length, EMA3Length, and EMA4Length inputs to any periods you prefer. Just ensure the periods are in ascending order (fast to slow) so the stack logic works correctly. Popular alternatives include 5/13/50/200, 10/20/50/200, and 8/21/55/200.
The EMA 200 line is very thick and dominates my chart. Can I make it thinner?
The thick EMA 200 line is intentional to emphasize the major structural trend anchor. If you prefer thinner lines, you can modify the plot widths. Right-click the indicator name and select Format [IndicatorName]. Go to the Plots tab. Select EMA200 and change the width from 3 to 2 or 1. Click OK. The line will become thinner.
I want to see the TrendScore value on my chart. How do I display it?
The TrendScore is plotted as Plot5 for reference in the TradeStation Data Window. Right-click on your chart and select Show Data Window. This will display the current TrendScore value numerically as you move your cursor over bars. Alternatively, you can add a subgraph: right-click the indicator name, select Format [IndicatorName], go to the Plots tab, select TrendScore, and change the plot style to display it as a line or histogram in a subgraph below your price chart.
For additional help, contact support.